When a database query is unexpectedly slow
[database performance postgresql In this micro post, I would like to share my experience in improving database query time.
I have recently encountered an issue that my PostgreSQL database query was surprisingly slow. I have an Offer table that has a foreign key to the Customer table that has a foreign key to the Company table:
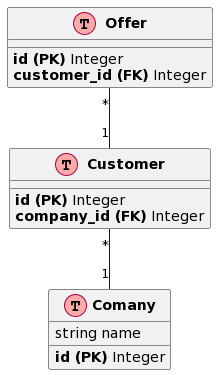
My goal was to count all Offer rows that are associated with the givencompany_id.
The table Offer is quite large (~ 4mln rows), but the timing of the query has been really poor. Although I have indexes on columns used for filtering and joining (ix_offer_customer_id and ix_customer_company_id), query time exceeds 3-4 seconds (sometimes reaches even 10-15 seconds).
For my query debugging, I have started with the EXPLAIN ANALYZE command to profile the query:
postgres=# explain analyze select count(*) from offer o join customer c on c.id = o.customer_id where company_id = 1010;
                                                                        QUERY PLAN
-----------------------------------------------------------------------------------------------------------------------------------------------------------
Aggregate  (cost=955320.63..955320.64 rows=1 width=8) (actual time=2118.923..2118.923 rows=1 loops=1)
   ->  Hash Join  (cost=794.72..955301.43 rows=7679 width=0) (actual time=1350.199..2118.842 rows=694 loops=1)
         Hash Cond: (o.customer_id = c.id)
         ->  Seq Scan on offer o  (cost=0.00..938843.85 rows=4156285 width=4) (actual time=0.036..1973.440 rows=4166966 loops=1)
         ->  Hash  (cost=792.20..792.20 rows=202 width=4) (actual time=2.354..2.354 rows=1205 loops=1)
               Buckets: 2048 (originally 1024)  Batches: 1 (originally 1)  Memory Usage: 59kB
               ->  Bitmap Heap Scan on customer c  (cost=17.98..792.20 rows=202 width=4) (actual time=0.581..2.123 rows=1205 loops=1)
                     Recheck Cond: (company_id = 1010)
                     Heap Blocks: exact=1321
                     ->  Bitmap Index Scan on ix_customer_company_id  (cost=0.00..17.93 rows=202 width=0) (actual time=0.376..0.376 rows=3001 loops=1)
                           Index Cond: (company_id = 1010)
 Planning time: 0.203 ms
 Execution time: 2118.962 ms
The above plan shows that my query does a sequential scan on the Offer table and the ix_customer_company_id index has not been exploited.
I came across a similar problem in StackOverflow while looking for a solution. It turned out that my table statistics estimation is not up-to-date and the query planner avoids using the ix_customer_company_id index. Executing ANALYZE offer command improved performance massively by decreasing query time from more than 3 seconds to several milliseconds:
postgres=# ANALYZE offer;
ANALYZE
postgres=# EXPLAIN ANALYZE select count(*) from offer o join customer c on c.id = o.customer_id where company_id = 1010;
                                                                                     QUERY PLAN
------------------------------------------------------------------------------------------------------------------------------------------------------------------------------------
Aggregate  (cost=3145.05..3145.06 rows=1 width=8) (actual time=11.308..11.308 rows=1 loops=1)
   ->  Nested Loop  (cost=18.41..3125.76 rows=7717 width=0) (actual time=0.573..11.209 rows=694 loops=1)
         ->  Bitmap Heap Scan on customer c  (cost=17.98..792.20 rows=202 width=4) (actual time=0.527..2.041 rows=1205 loops=1)
               Recheck Cond: (company_id = 1010)
               Heap Blocks: exact=1321
               ->  Bitmap Index Scan on ix_cusrtomer_company_id  (cost=0.00..17.93 rows=202 width=0) (actual time=0.325..0.325 rows=3001 loops=1)
                     Index Cond: (company_id = 1010)
         ->  Index Only Scan using ix_offer_customer_id on offer i  (cost=0.43..11.48 rows=7 width=4) (actual time=0.002..0.007 rows=1 loops=1205)
               Index Cond: (customer_id = c.id)
               Heap Fetches: 1279
 Planning time: 0.519 ms
 Execution time: 11.337 ms
The ANALYZE command is non-blocking and quite fast, so it can be executed quite regularly. You should remember about it especially when a table’s contents have substantially changed (e.g. a lot of added, updated, or deleted rows). If you run into a similar problem, it should be one of the first things you try. I hope it helps and saves your debugging time.