Understanding Distributed Tracing: A Python Guide with OpenTelemetry and Grafana Tempo
[programming learning devops observability distributed-tracing opentelemetry python Overview
Tracing is a critical component of modern observability methods, along with metrics and logging. It is a technique used in software systems to monitor and profile the behavior of applications in a distributed, microservices-based environment. It helps you understand how requests flow through various components of your application and can be useful for diagnosing performance issues and understanding the interactions between services.
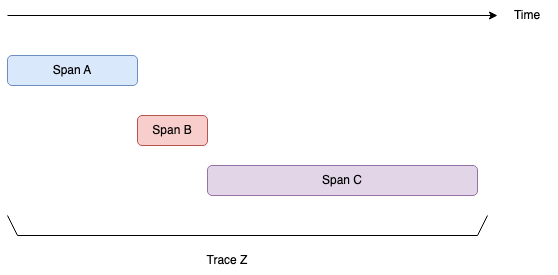
In distributed tracing, several fundamental concepts are used to represent and organize the data collected while monitoring a distributed system. Two key concepts are “trace” and “span,” which provide a structured view of how requests flow through various services in your application.
-
A span represents a single unit of work within a trace. Spans capture specific information about an operation or action that occurs within a service or component of the application. Spans have attributes, such as a start time, end time, duration, and a unique span ID. Spans can be nested and the granularity of spans is either a business or technical decision (or both).
-
A trace represents the overall journey of a single request or transaction as it moves through various components of a distributed system. It is a collection of related spans that form a complete picture of the request’s path. A trace typically starts when a request enters the system and ends when it is fully processed and a response is sent.
Distributed tracing offers several significant gains and benefits for software development and operations in complex, microservices-based applications. Tracing provides a comprehensive view of how requests and transactions flow through various services in your application. This visibility helps you understand the entire path and interactions, which can be crucial for identifying bottlenecks and dependencies. You can follow the path of a request and quickly identify which service or component is responsible for the problem. Traced systems can also create dependency graphs that visualize how different services interact with each other. This mapping is invaluable for understanding the relationships and dependencies in a microservices architecture.
Architecture
Tracing in a distributed system typically involves a combination of components on both the application side and the tracing platform side to capture, process, store, and visualize trace data.
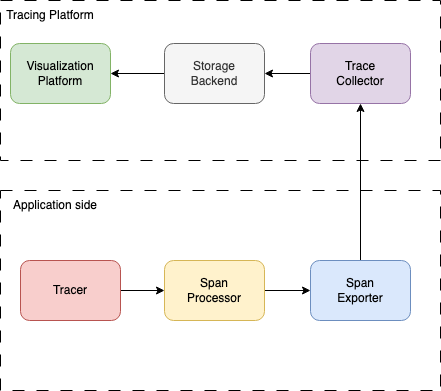
Here’s an overview of these components.
- Application side:
-
The Tracer is responsible for creating and managing spans within your application. It captures data about the execution of specific operations or actions.
-
The Span Processor is responsible for processing and potentially transforming the trace data generated by the Tracer. It can perform actions like sampling, merging spans, adding metadata, or redacting sensitive information.
-
The Span Exporter is responsible for packaging trace data, including spans, and sending it to a remote trace collector or backend. Exporters are often configured to use specific protocols and data formats.
- Tracing platform:
-
The Trace Collector primarily acts as an intermediary that receives trace data from instrumented applications performs initial processing, and then forwards the data to a backend for long-term storage and analysis. The collector itself does not typically store the trace data for an extended period. Its main functions include.
-
The Storage Backend is where processed trace data is stored for the long term. Common choices include databases (e.g., Elasticsearch, Cassandra), cloud-based storage services, etc.
-
The Visualization Platform is used to query and visualize trace data. It includes tools like Grafana Tempo, Jaeger UI, or other tracing systems. These platforms provide dashboards, charts, and query interfaces for exploring and analyzing trace information.
Tracing configuration - OpenTelemetry SDK
OpenTelemetry is a versatile framework for distributed tracing and observability that fits into the architecture described previously. It plays a crucial role in instrumenting applications, capturing trace data, and exporting it to various destinations in a distributed tracing system. In the next sections, I would like to present how to:
-
configure tracing within application code using OpenTelemetry SDK,
-
set up OpenTelemetry collector and Grafana Tempo to receive traces from the application, store them, and visualize them.
To provide an example, let’s consider a simple Python Flask application whose primary feature is item reservation. For the purpose of this demonstration, we will simplify its logic to focus exclusively on distributed tracing.
# app.py

import logging
from flask import Flask

from .tracing import tracer, SERVICE_NAME

tracer = trace.get_tracer(SERVICE_NAME)

app = Flask(__name__)

@dataclass(frozen=True)
class ReservationCommand:
    username: str
    item_id: str

@app.route("/reservations", methods=["POST"])
def reservations():
    with tracer.start_as_current_span("reservations_handler"):
        command = _parse_request(request)
        limit = _fetch_limit(command.username, carrier)
        if limit < 0:
            return jsonify("failure, limit not found")
        reservations_count = _fetch_reservations_count(command.username)
        if reservations_count > limit:
            return jsonify("failure, limit exceeded")
        _make_reservation(command.username, command.item_id)
    return jsonify("success")

@tracer.start_as_current_span("parse_request")
def _parse_request(request):
    time.sleep(0.01 * randint(0, 4))
    return ReservationCommand(
        username=request.json["username"],
        item_id=request.json["item_id"],
    )

@tracer.start_as_current_span("fetch_limit")
def _fetch_limit(username, carrier):
    time.sleep(0.01 * randint(0, 4))
    return randint(0 , 10)

@tracer.start_as_current_span("fetch_reservations_count")
def _fetch_reservations_count(username):
    time.sleep(0.07 * randint(0, 8))
    return randint(0, 7)

@tracer.start_as_current_span("make_reservation")
def _make_reservation(username, item_id):
    time.sleep(0.03 * randint(0, len(item_id) + 2))
The spans are created in two ways:
-
using the context manager
with tracer.start_as_current_span -
using the decorator
@tracer.start_as_current_span
Executing the decorator or context manager instance (child) within another context manager instance (parent) will generate a nested span.
The main business use case implemented by reservations handler is represented as a top-level parent span named reservation_handler. The rest four spans: parse_request, fetch_limit, fetch_reservations_count and make_reservation are nested within the reservation_handler parent span.
Initially, we configured a tracing to use a console span exporter. At this stage, we do not need a trace collector and could test gathering spans and traces without a remote tracing platform setup.
# tracing.py

import os

from opentelemetry import trace
from opentelemetry.sdk.resources import Resource
from opentelemetry.sdk.trace import TracerProvider
from opentelemetry.sdk.trace.export import BatchSpanProcessor, \
    ConsoleSpanExporter

SERVICE_NAME = "reservations-service"

resource = Resource(attributes={"service.name": SERVICE_NAME})
provider = TracerProvider(resource=resource)
exporter = ConsoleSpanExporter()
processor = BatchSpanProcessor(exporter)
provider.add_span_processor(processor)

trace.set_tracer_provider(provider)
tracer = trace.get_tracer(SERVICE_NAME)
Now we can start the application and gather the first trace from it by sending a reservation request:
>> flask run -p 8081
>> curl -X POST http://localhost:8081/reservations -H "Content-Type: application/json" -d '{"username": "test", "item_id": "123"}'
As we mentioned before, the console is our configured trace exporter, so we should see the following trace in the terminal:
{
    "name": "parse_request",
    "context": {
        "trace_id": "0x277937fb46a0102a713bcf19f48a19e0",
        "span_id": "0xaa22de6fe023494e",
        "trace_state": "[]"
    },
    "kind": "SpanKind.INTERNAL",
    "parent_id": "0x0e0033f52f2d25c8",
    "start_time": "2023-10-30T10:12:06.842374Z",
    "end_time": "2023-10-30T10:12:06.875955Z",
    "status": {
        "status_code": "UNSET"
    },
    "attributes": {},
    "events": [],
    "links": [],
    "resource": {
        "attributes": {
            "service.name": "reservations-service"
        },
        "schema_url": ""
    }
}
{
    "name": "fetch_limit",
    "context": {
        "trace_id": "0x277937fb46a0102a713bcf19f48a19e0",
        "span_id": "0xc258ce18b1604a42",
        "trace_state": "[]"
    },
    ...
}
{
    "name": "fetch_reservations_count",
    "context": {
        "trace_id": "0x277937fb46a0102a713bcf19f48a19e0",
        "span_id": "0x8f4881e7cf6b1466",
        "trace_state": "[]"
    },
    ...
}
{
    "name": "make_reservation",
    "context": {
        "trace_id": "0x277937fb46a0102a713bcf19f48a19e0",
        "span_id": "0xf3dd12df7b53cb7e",
        "trace_state": "[]"
    },
    ...
}
{
    "name": "reservations_handler",
    "context": {
        "trace_id": "0x277937fb46a0102a713bcf19f48a19e0",
        "span_id": "0x0e0033f52f2d25c8",
        "trace_state": "[]"
    },
    ...
}
The five spans were generated within a single trace (all spans have the same trace ID).
While the console exporter serves as a useful starting point for tracing, configuring the application to send traces to a remote collector is imperative to ensure its readiness for production. And it would be our next step.
OpenTelemetry Span Exporter and Collector
The simple Docker Compose file can be used to run OpenTelemetry Collector and our application that provides traces.
# docker-compose.yaml

version: "3"
services:
    reservations-service:
    image: reservations-service:v1
    ports:
      - "8081:8081"
    environment:
      - OTEL_COLLECTOR_ENDPOINT=otel-collector:4317

  otel-collector:
    image: otel/opentelemetry-collector:latest
    volumes:
      - ./otel-collector-config.yaml:/etc/otel-collector-config.yaml
    command: ["--config=/etc/otel-collector-config.yaml"]
    ports:
      - "4317"  # otlp grpc
The OpenTelemetry collector is defined by the otel-collector-config.yaml that would be mounted in the running collector container.
# otel-collector-config.yaml
receivers:
  otlp:
    protocols:
      grpc:
exporters:
  otlp:
    endpoint: tempo:4317
    tls:
      insecure: true
service:
  pipelines:
    traces:
      receivers: [otlp]
      exporters: [otlp]
The traces in otlp standard would be received by the collector using grpc protocol. The exporters’ section defines where traces would be routed by the collector. In our case, it would be the Grafana Tempo backend (that would be set up in the next section).
In the application code, we need to exchange the span exporter. The new exporter OTLPSpanExporter would be compatible with the OpenTelemetry collector.
# tracing.py

from opentelemetry import trace
from opentelemetry.exporter.otlp.proto.grpc.trace_exporter import \
    OTLPSpanExporter
from opentelemetry.sdk.resources import Resource
from opentelemetry.sdk.trace import TracerProvider
from opentelemetry.sdk.trace.export import BatchSpanProcessor
from opentelemetry.trace.propagation.tracecontext import \
    TraceContextTextMapPropagator

SERVICE_NAME = "reservations-service"
OTEL_COLLECTOR_ENDPOINT = os.environ["OTEL_COLLECTOR_ENDPOINT"]

resource = Resource(attributes={"service.name": SERVICE_NAME})

provider = TracerProvider(resource=resource)
otlp_exporter = OTLPSpanExporter(
    endpoint=OTEL_COLLECTOR_ENDPOINT, insecure=True
)
processor = BatchSpanProcessor(otlp_exporter)
provider.add_span_processor(processor)

trace.set_tracer_provider(provider)
tracer = trace.get_tracer(SERVICE_NAME)
The address of the OpenTelemetry collector: otel-collector:4317 is injected into the application by the environment variable defined in docker-compose.yaml file. We need also a docker file that will be used to build the image: reservations-service:v1.
# Dockerfile
FROM python:3.9-slim
RUN apt-get update && apt-get install build-essential -y
COPY app.py requirements.txt /
RUN pip install -r requirements.txt
EXPOSE 8081
CMD ["flask", "run", "-h", "0.0.0.0", "-p", "8081"]
The next step is the Grafana Tempo setup to visualize traces produced by the application.
Data Visualization - Grafana Tempo
Grafana Tempo is used for storing and querying trace data, offering fast and efficient retrieval of trace information. It’s often used in combination with other components, such as OpenTelemetry collectors and span exporters, which send data to Tempo for long-term storage and analysis.
We need to configure two components:
- The Tempo (
tempo.yaml) which would store traces:
server:
  http_listen_port: 3200

distributor:
  receivers:
    otlp:
      protocols:
        grpc:

ingester:
  max_block_duration: 5m

compactor:
  compaction:
    block_retention: 1h
storage:
  trace:
    backend: local
    wal:
      path: /tmp/tempo/wal
    local:
      path: /tmp/tempo/blocks
- The Grafana (
grafana.yaml) which would be our data visualizer (with Tempo as the data source):
apiVersion: 1

datasources:
- name: Tempo
  type: tempo
  access: proxy
  orgId: 1
  url: http://tempo:3200
  basicAuth: false
  isDefault: true
  version: 1
  editable: false
  apiVersion: 1
  uid: tempo
  jsonData:
    httpMethod: GET
These two components now must be added to the Docker Compose stack with proper config file mounting:
version: "3"
services:
  ...

  tempo:
    image: grafana/tempo:latest
    command: [ "-config.file=/etc/tempo.yaml"]
    volumes:
      - ./tempo.yaml:/etc/tempo.yaml
      - ./tempo-data:/tmp/tempo
    ports:
      - "3200"   # tempo
      - "4317"  # otlp grpc

  grafana:
    image: grafana/grafana:10.1.1
    volumes:
      - ./grafana.yaml:/etc/grafana/provisioning/datasources/datasources.yaml
    environment:
      - GF_AUTH_ANONYMOUS_ENABLED=true
      - GF_AUTH_ANONYMOUS_ORG_ROLE=Admin
      - GF_AUTH_DISABLE_LOGIN_FORM=true
      - GF_FEATURE_TOGGLES_ENABLE=traceqlEditor
    ports:
      - "3000:3000"
Now we can run our system and send the reservation request.
>> docker-compose up
>> curl -X POST http://localhost:8081/reservations -H "Content-Type: application/json" -d '{"username": "test", "item_id": "123"}'
We expose Grafana 3000 port to make it accessible for the browser address: http://localhost:3000. The trace data can be found in the Explore tab (data source: Tempo ).
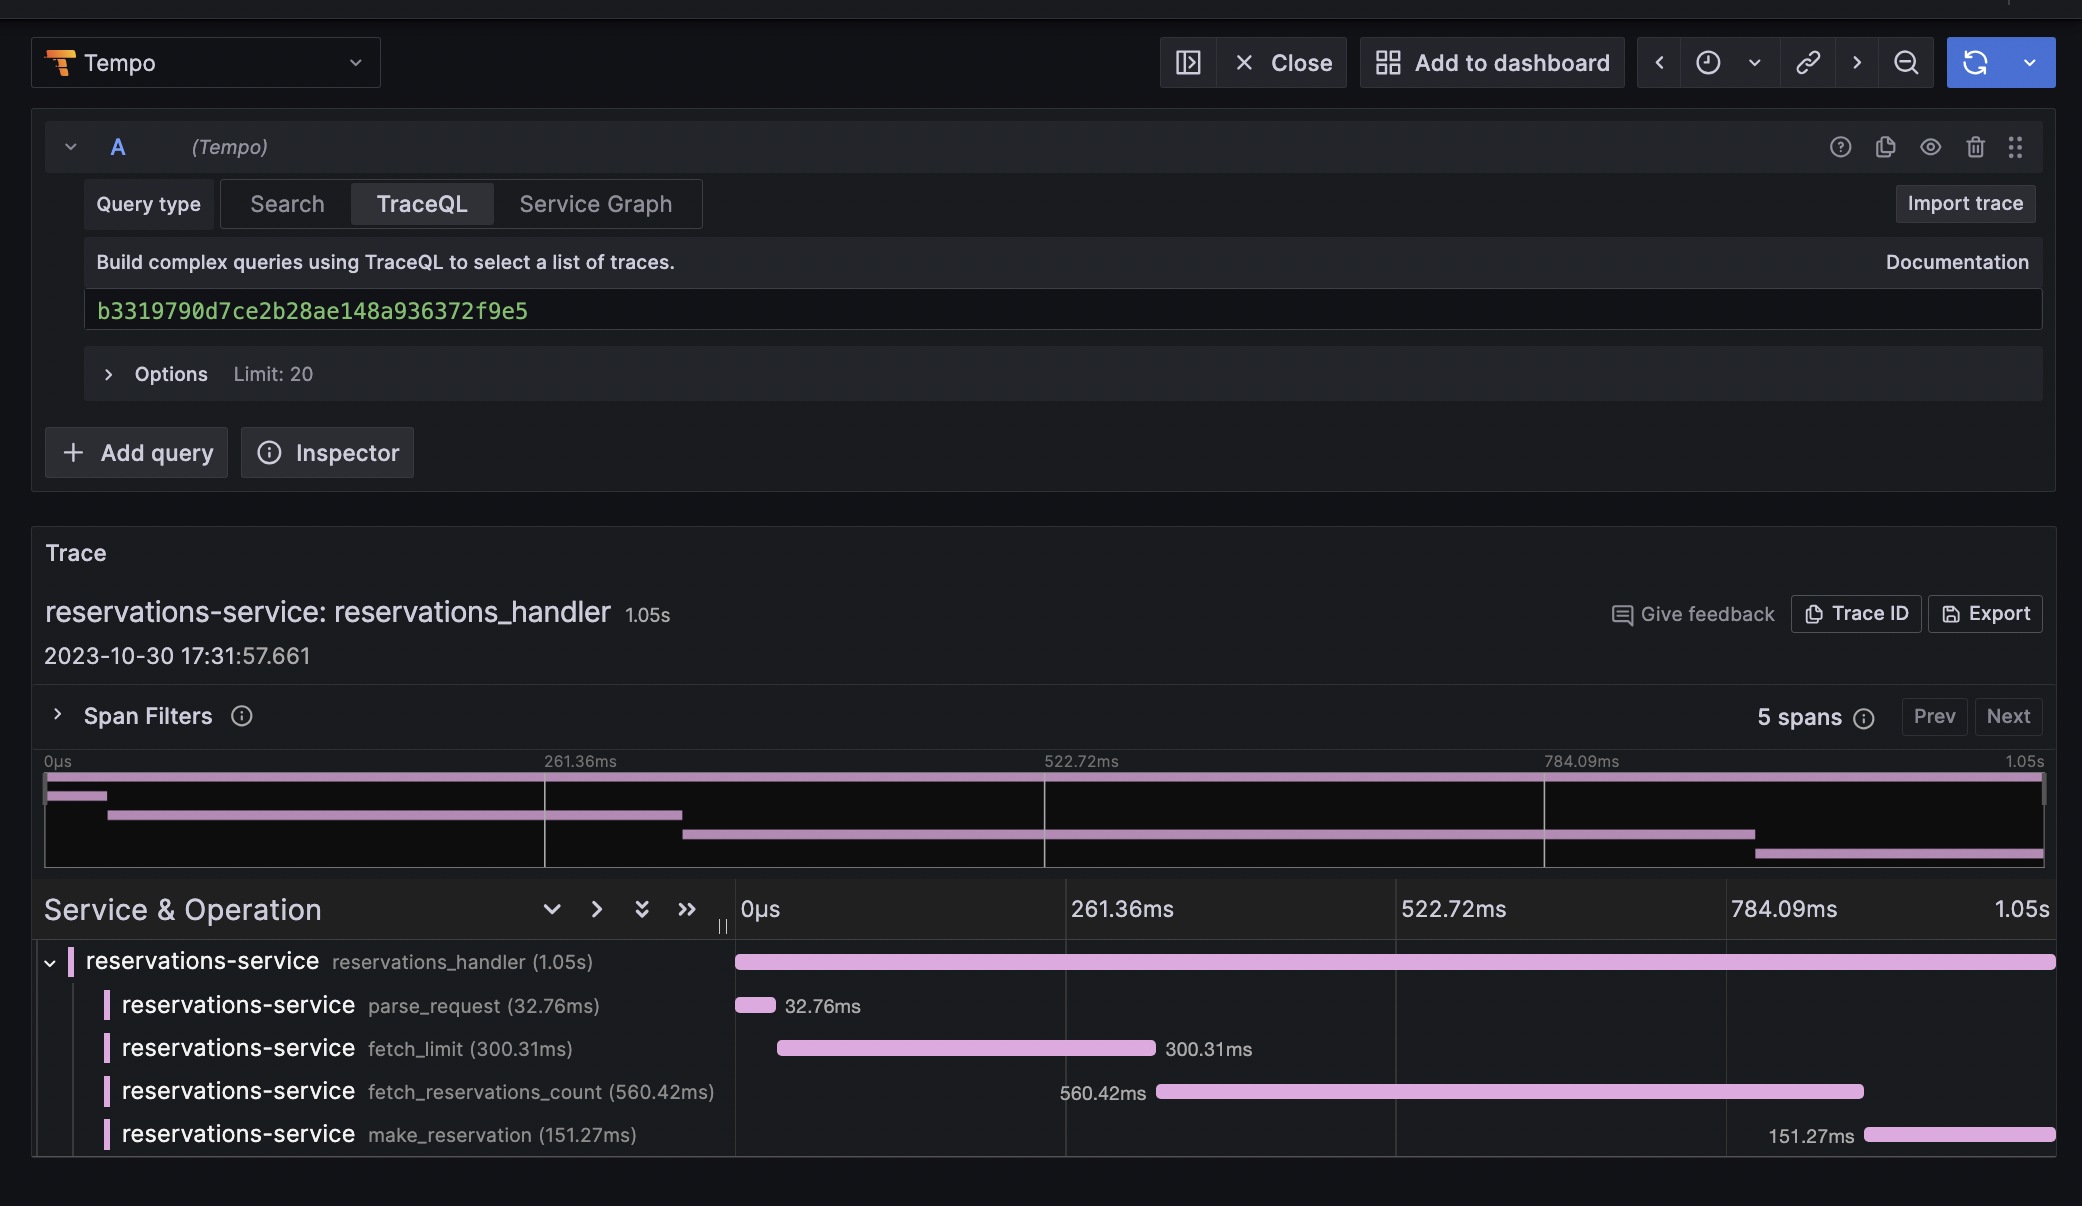
Spans are organized in a hierarchical or tree-like structure within a trace. We can see a single-parent span reservations_handler that lasts 1.05s and four child spans that are executed sequentially within the parent.
As we have already discussed, tracing is particularly helpful for tracking request pathways across multiple services in a distributed context. We will add a user-service to our stack and address context propagation between services in the following section.
Context propagation
Context propagation in distributed tracing refers to the process of passing trace context or trace identifiers from one service to another as a request travels through various components of a distributed system. This trace context allows you to link together all the operations (spans) associated with a single request, even as it traverses multiple services. Context propagation is essential for constructing complete traces and visualizing the end-to-end flow of a request. A top-level span in each service would provide a distinct trace if we ignored context propagation between services.
We make our system more complex and will take reservation limits from another Python service (user-service) that is deployed independently.
# app.py

from flask import Flask

from .tracing import tracer, SERVICE_NAME

tracer = trace.get_tracer(SERVICE_NAME)

app = Flask(__name__)

@app.route("/users/<string:username>/limits")
def reservation_limits(username):
    with tracer.start_as_current_span("reservation_limits_handler", context=ctx):
        _validate_username(username)
        record = _fetch_record(username)
    return jsonify(record)

@tracer.start_as_current_span("validate_username")
def _validate_username(username):
    time.sleep(0.04 * randint(0, 10))

@tracer.start_as_current_span("fetch_record")
def _fetch_record(username):
    time.sleep(0.1 * randint(0, 6))
    return {
        "username": username,
        "limits": {
            "reservations": len(username),
        },
    }
The user-service:v1 image must be built and added to the Docker Compose stack. The URL address for user-service must also be added to the reservations-service configuration.
version: "3"
services:
  user-service:
    image: user-service:v1
    ports:
      - "8080:8080"
    environment:
      - OTEL_COLLECTOR_ENDPOINT=otel-collector:4317

  reservations-service:
    image: reservations-service:v1
    ports:
      - "8081:8081"
    environment:
      - OTEL_COLLECTOR_ENDPOINT=otel-collector:4317
      - USER_SERVICE_URL=http://user-service:8080
   ...
Before sending the request, the reservations-service injects trace context (carrier) into the request headers. This allows downstream services to access the trace context.
import requests
from opentelemetry.trace.propagation.tracecontext import \
    TraceContextTextMapPropagator

USER_SERVICE_URL = os.environ['USER_SERVICE_URL']

@app.route("/reservations", methods=["POST"])
def reservations():
    with tracer.start_as_current_span("reservations_handler"):
        command = _parse_request(request)
        carrier = {}
        TraceContextTextMapPropagator().inject(carrier=carrier)
        limit = _fetch_limit(command.username, carrier)
        ...

@tracer.start_as_current_span("fetch_limit")
def _fetch_limit(username, carrier):
    url = f"{USER_SERVICE_URL}/users/{username}/limits"
    try:
        response = requests.get(url, timeout=10, headers=carrier)
        logging.info("Send request with headers: {}".format(carrier))
        return response.json()["limits"]["reservations"]
    except Exception:
        logging.exception("Error fetching limit for user {}".format(username))
        return -1
When user-service receives an incoming request, it extracts the trace context from the request headers to ensure that the trace is continued (here is a description of the context propagation header standard). This extracted context is used to create and connect the span for the operations performed by that service.
from opentelemetry.trace.propagation.tracecontext import \
    TraceContextTextMapPropagator

@app.route("/users/<string:username>/limits")
def reservation_limits(username):
    ctx = TraceContextTextMapPropagator().extract(carrier=request.headers)
    with tracer.start_as_current_span(
        "reservation_limits_handler", context=ctx
    ):
        _validate_username(username)
        record = _fetch_record(username)
    return jsonify(record)
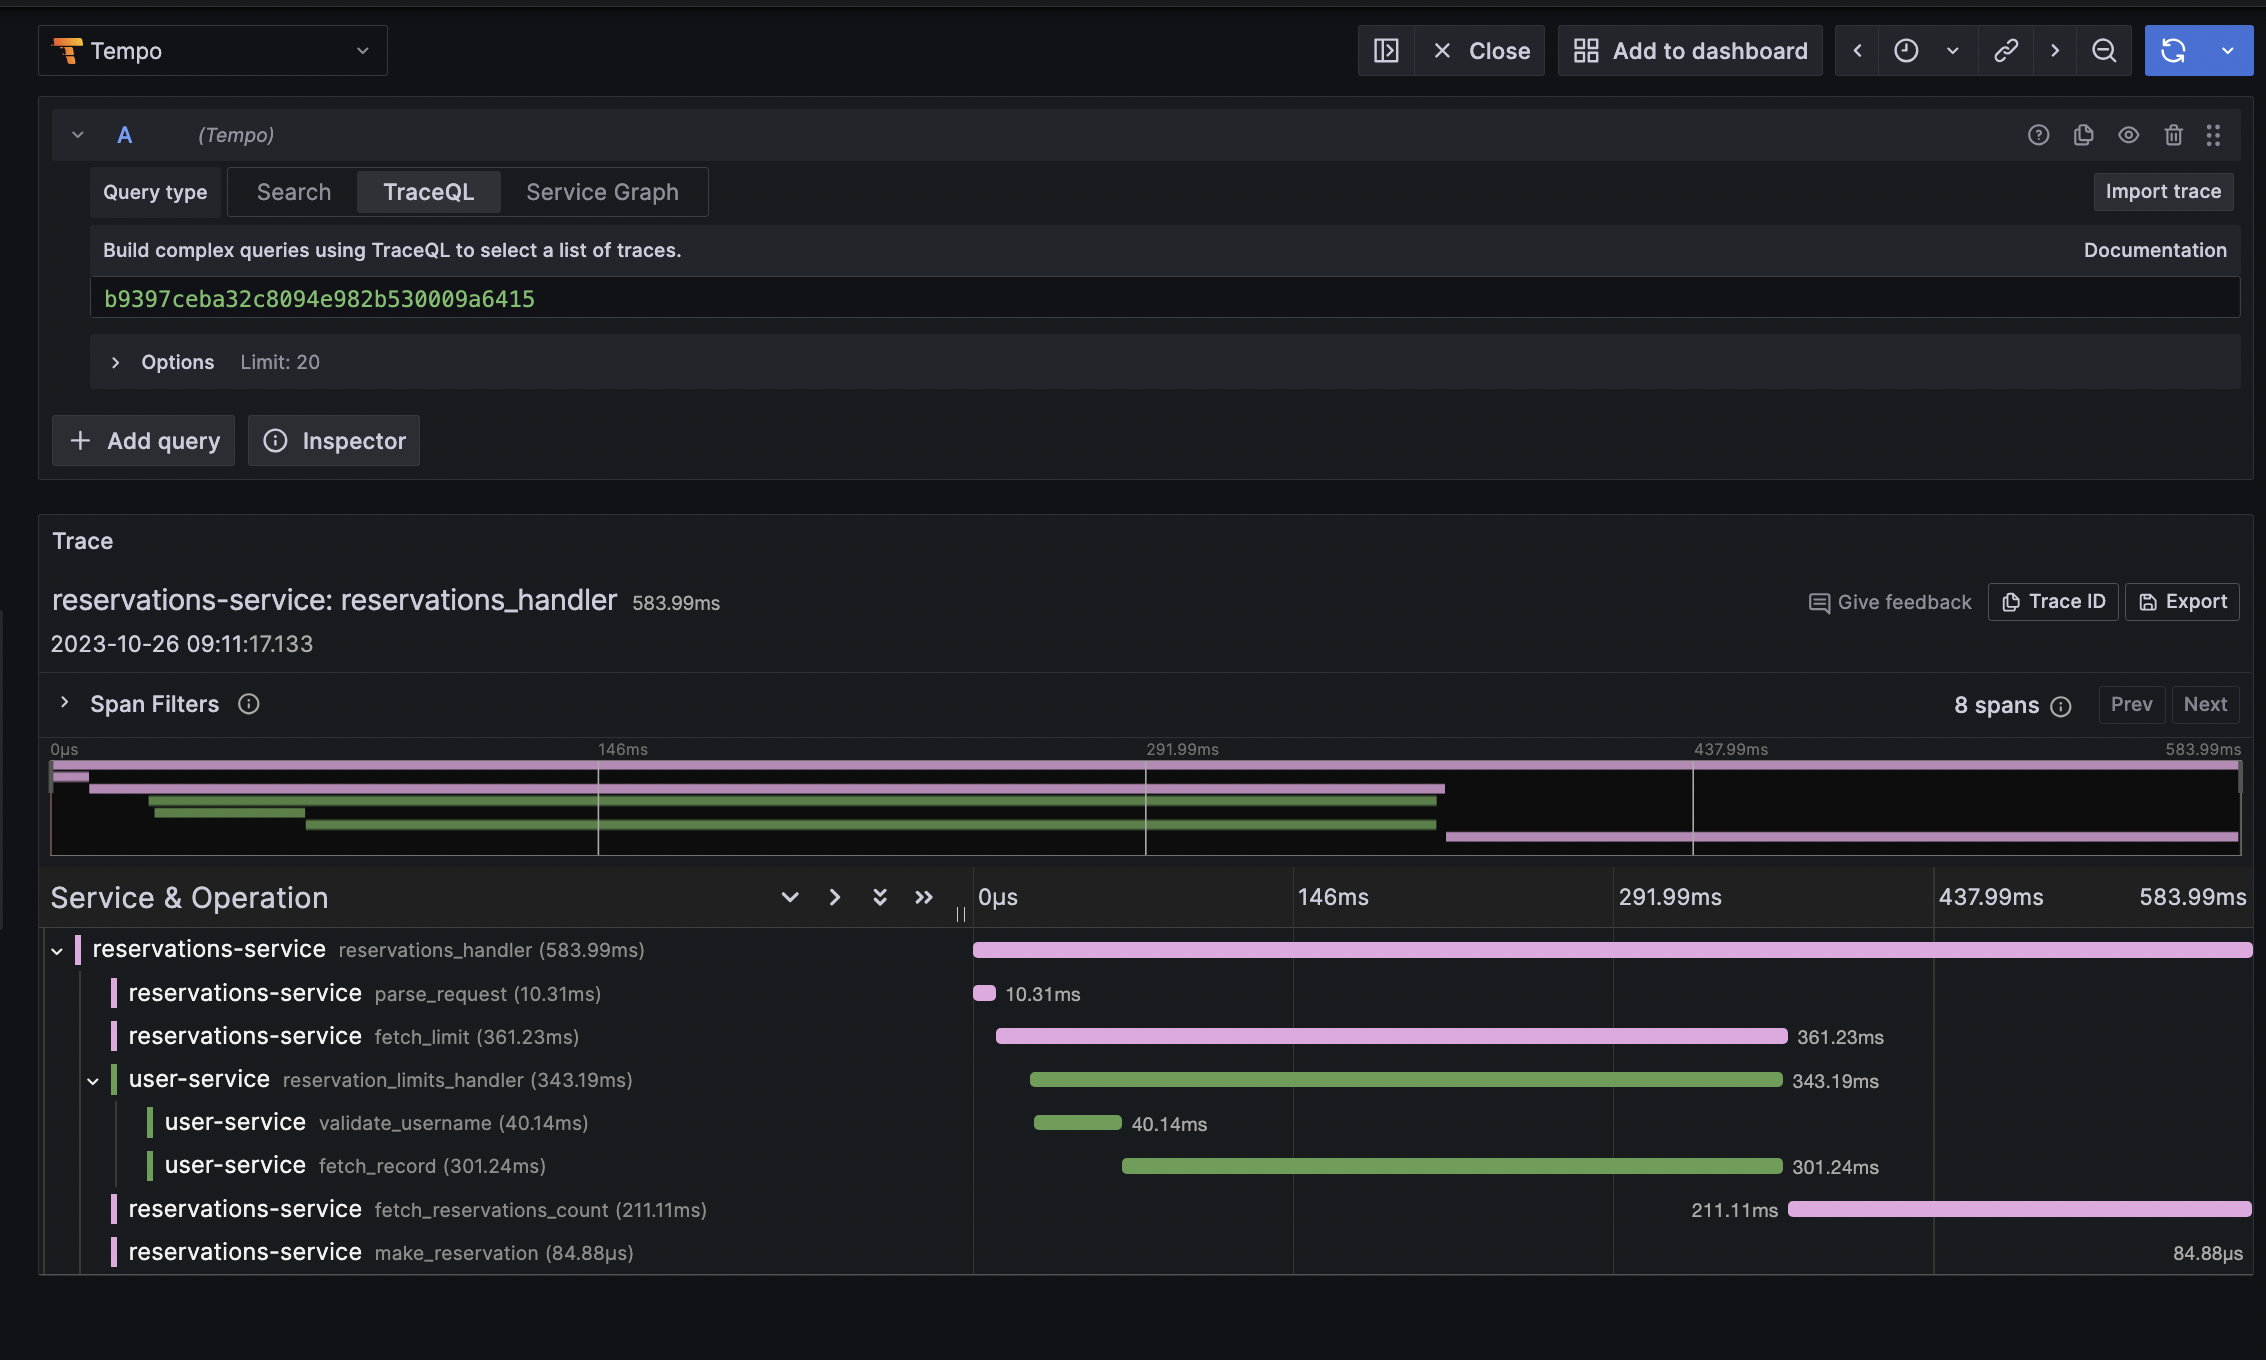
Now if we start the system and make a reservation request we should find a single trace that properly links spans from two different services.
Conclusion
In this blog post, we embarked on a journey through the realm of distributed tracing, exploring its fundamental concepts and architecture. We delved into the intricate web of trace propagation that connects the dots in a world of microservices, shedding light on how tracing can demystify the behavior of complex, distributed systems.
This post is only an introduction and we have not covered topics like asynchronous communication tracing or passing additional attributes to spans. However, I hope it will still be helpful.
To make the post easier to read, several code snippets were simplified. The full version of the implementation can be found here.
References
-
https://opentelemetry.io/docs/instrumentation/python/cookbook/
-
https://grafana.com/go/webinar/getting-started-with-tracing-and-grafana-tempo-emea/
-
https://www.timescale.com/blog/prometheus-vs-opentelemetry-metrics-a-complete-guide/
-
https://opentelemetry.io/docs/instrumentation/python/getting-started/
-
https://www.cncf.io/blog/2022/04/22/opentelemetry-and-python-a-complete-instrumentation-guide/
-
https://codersociety.com/blog/articles/jaeger-vs-zipkin-vs-tempo
-
https://signoz.io/blog/context-propagation-in-distributed-tracing/
-
https://betterprogramming.pub/trace-context-propagation-with-opentelemetry-b8816f2f065e