How to build an alerting system with Prometheus and Alertmanager
[learning monitoring devops prometheus alert sre Introduction
While Prometheus is excellent at collecting and storing metrics, it does not provide a built-in mechanism for alert notifications.
This is where Alertmanager comes in. Alertmanager is a component of the Prometheus ecosystem that manages and sends alerts based on the rules defined in Prometheus. It allows you to configure different alerting rules for different sets of metrics and specify how you want to receive alerts, such as via email, text messages, Slack, PagerDuty, or other integrations.
Without Alertmanager, Prometheus would be limited to only collecting and storing metrics without providing any actionable alerts when certain thresholds or conditions are met. Therefore, Alertmanager is a crucial component of the Prometheus ecosystem that complements its monitoring capabilities by enabling efficient and reliable alerting.
How Alertmanager works
The Prometheus server is a component that sends alerts to Alertmanager. Alertmanager is responsible for receiving, deduplicating, grouping, and routing alerts to various notification systems such as email, webhook, or other alerting systems via an API. Alertmanager also provides additional features such as silence management, notification inhibition, and alert template rendering.
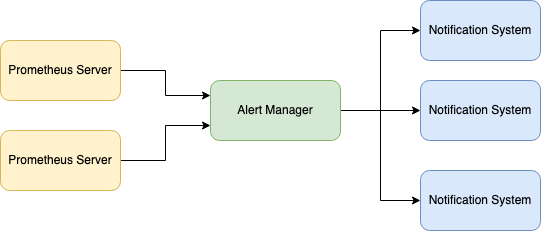
The receivers can be configured to handle the alerts in different ways, such as sending an email, triggering a webhook, or forwarding the alert to another system for further processing. Alertmanager comes with built-in support for various receivers, but it also allows users to define custom receivers to meet their specific needs.
Alertmanager is composed of several components that work together to provide a flexible and powerful alert management system.
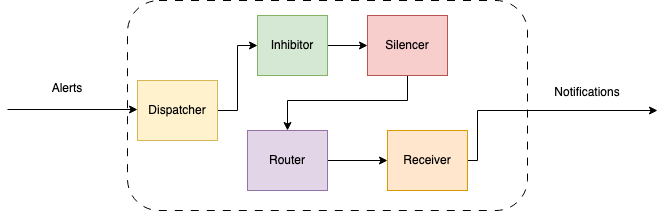
Here is a brief overview of some of the key Alertmanager components:
-
Dispatcher is responsible for processing incoming alerts, deduplicating them, grouping them by their labels, and sending them to the router.
-
Inhibitor allows users to suppress alerts based on the presence of other alerts. This can be useful in situations where a higher-level alert should suppress lower-level alerts to avoid unnecessary noise. For example, if a server is down, there is no need to receive alerts for all of the services running on that server.
-
Silencer allows users to temporarily suppress alerts for a given period of time. This can be useful in situations where a known issue is being addressed or during maintenance windows when alerts are not needed. The Silencer supports both manual and automatic silencing based on a set of predefined rules.
-
Router is responsible for determining which receiver(s) should receive a given alert. It uses a set of routing rules that are defined by the user to match alerts based on their labels and route them to the appropriate receiver(s). The Router supports powerful regular expression matching and can be configured to route alerts based on the severity or type of the alert.
-
Receiver is a key component that defines how alerts are sent to various notification channels or systems. The Receiver is essentially a target for alerts, and it defines which notification channels should be used for a particular alert.
Overall, these Alertmanager components work together to provide a flexible and powerful alert management system that can be customized to meet the specific needs of each user or organization.
Alerting rules
Alertmanager does not trigger alerts, it is done by the Prometheus server. So in the first step, we would define and trigger an alert on the Prometheus side without handling it by any notifications target.
In the previous post, we set up the Prometheus server to collect metrics from a web application. Now, we can use the existing Docker Compose file and extend it with some configurations.
At first, we have to define a Prometheus rules file. In the rules file we define a list of groups identified by name key. Each rules group is executed in parallel. Within a group, we can determine a set of rules (alerting rules, but also recording rules) that are evaluated sequentially. The simplest alert that would be very useful and easy to test is a check whether our application is alive.
# rules.yml
groups:
  - name: web-app
    rules:
      - alert: Application down
        for: 1m
        expr: up{job="web-app"} == 0
        labels:
          severity: critical
        annotations:
          title: App is down on
          description: The app on instance  has been down for the past 1 minute.
In our example, we have defined one rule that is checking whether the application is down using metric up{job="web-app"} . The for parameter in Prometheus alerting rules specifies the duration of time that a condition must be true before an alert fires. It is used to prevent false positives by ensuring that the condition is sustained over a certain period of time before triggering an alert. We have also added a label severity: critical that would be useful when we would route notifications. Labels are used to classify alerts, while annotations provide additional information about incidents.
To configure a rules file in Prometheus, we need to add its path to rule_files section in the prometheus.yml configuration file.
# prometheus.yml
global:
  scrape_interval: 15s
rule_files:
  - "rules.yml"
scrape_configs:
  - job_name: "prometheus"
    scrape_interval: 5s
    static_configs:
      - targets: ["localhost:9090"]
  - job_name: "web-app"
    scrape_interval: 5s
    static_configs:
      - targets: ["web-app:8000"]
If we store our rules file in the same folder as prometheus.yml file, we can use a relative file path. To make it happen, we have to modify our Docker Compose file with proper rules.yml file binding.
# docker-compose.yml
version: "3.7"

services:
  prometheus:
    image: prom/prometheus
    ports:
      - target: 9090
        published: 9090
    volumes:
      - type: bind
        source: ./prometheus.yml
        target: /etc/prometheus/prometheus.yml
      - type: bind
        source: ./rules.yml
        target: /etc/prometheus/rules.yml
      - ./prometheus_data:/prometheus
    command:
      - '--config.file=/etc/prometheus/prometheus.yml'
      - '--storage.tsdb.path=/prometheus'

  web-app:
    image: web-app-monitoring:v0
    ports:
      - target: 8000
        published: 8080
Now we can start our Docker Compose stack:
$ docker-compose up
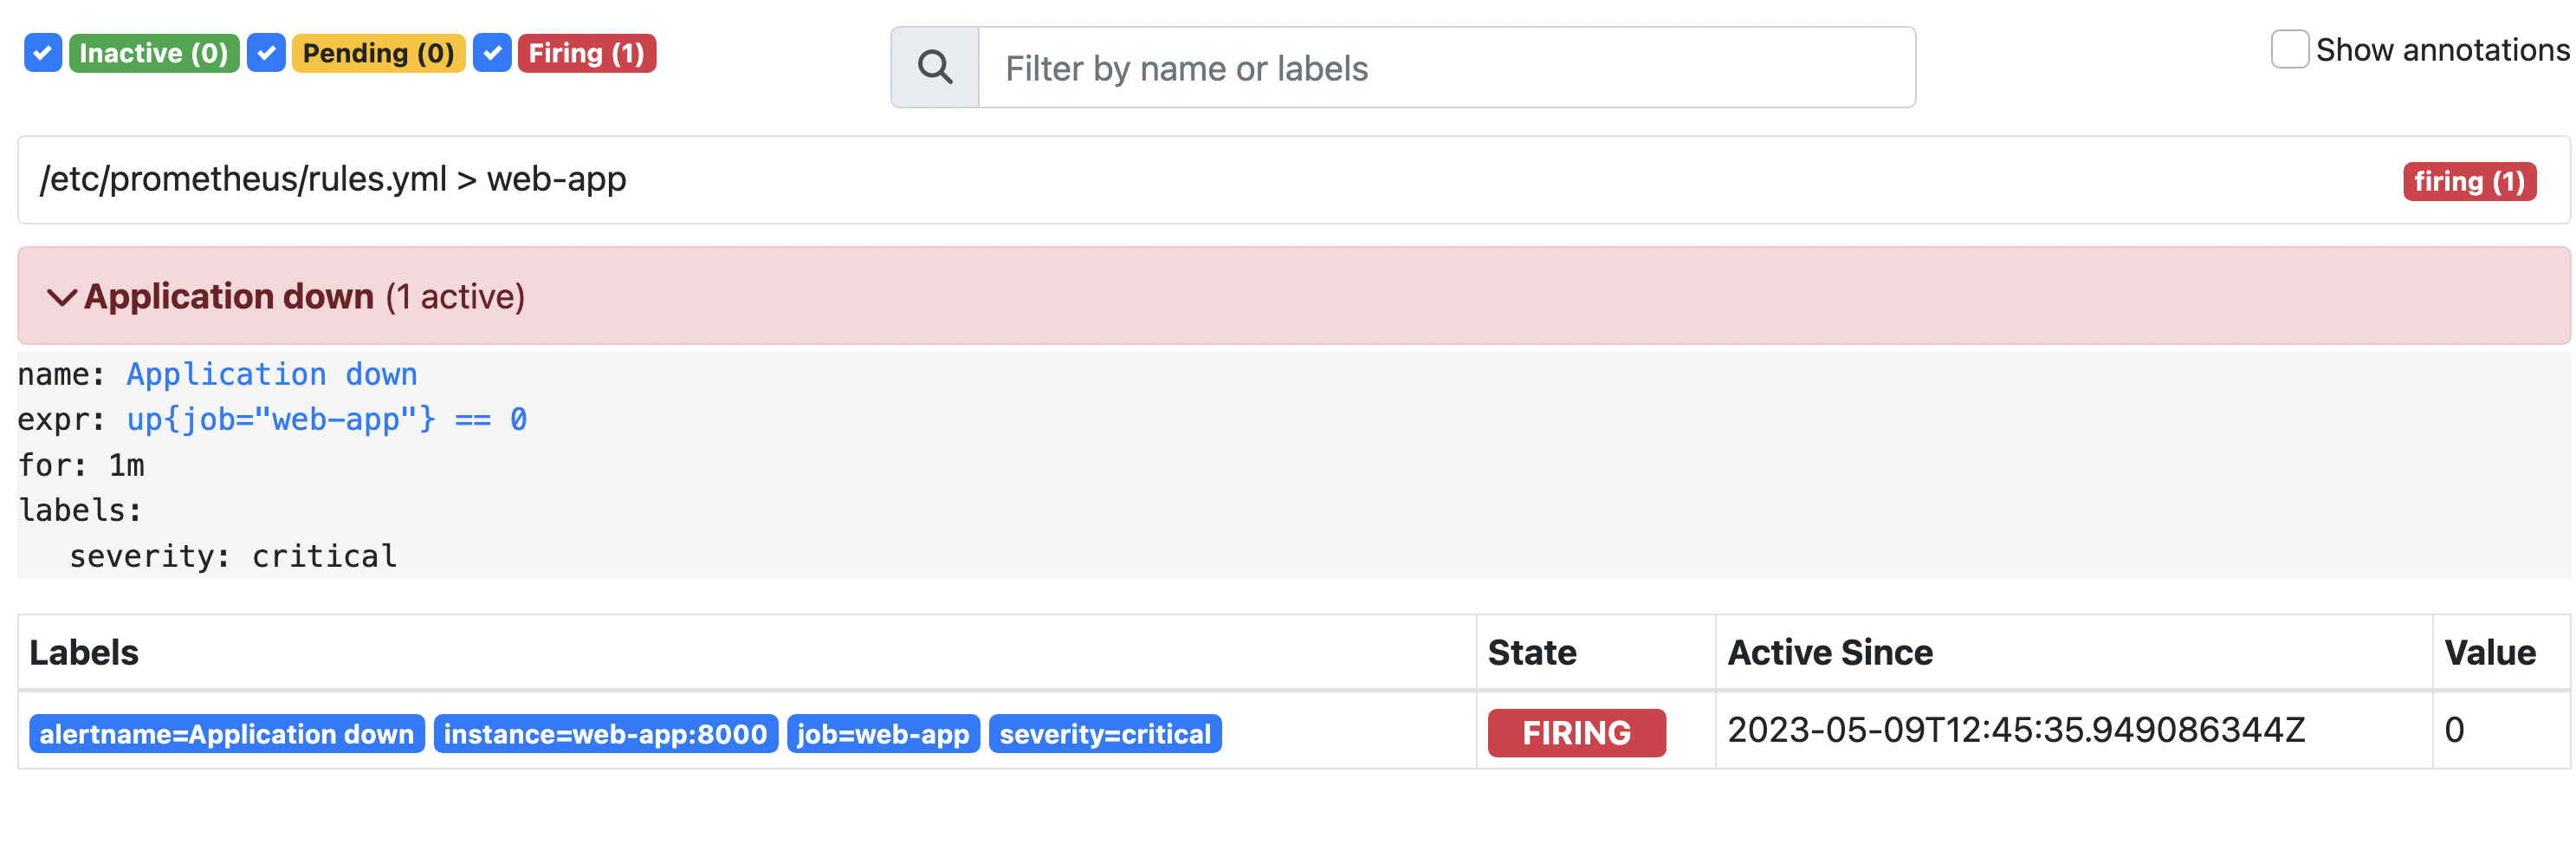
Our application and the Prometheus server should be running. We can check the alerts definition and state in the Prometheus UI (http://localhost:9090/alerts):
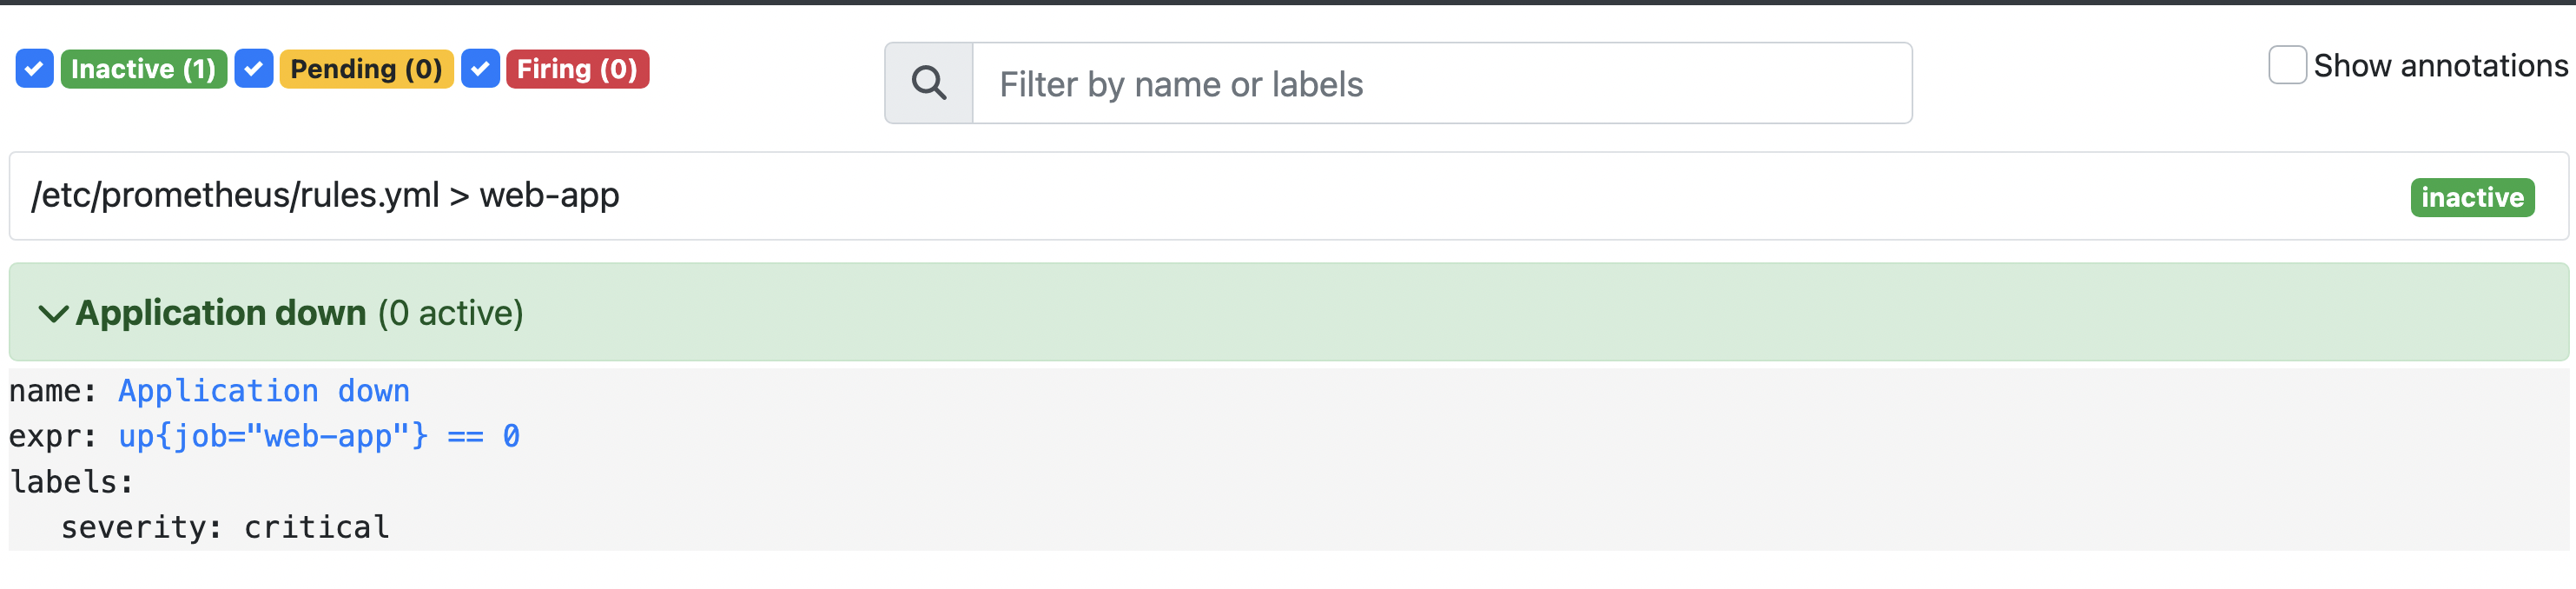
We can see that there is one alert called “Application down” in the inactive state. It means that our application is running at the moment.
To trigger an alert we would kill the application process.
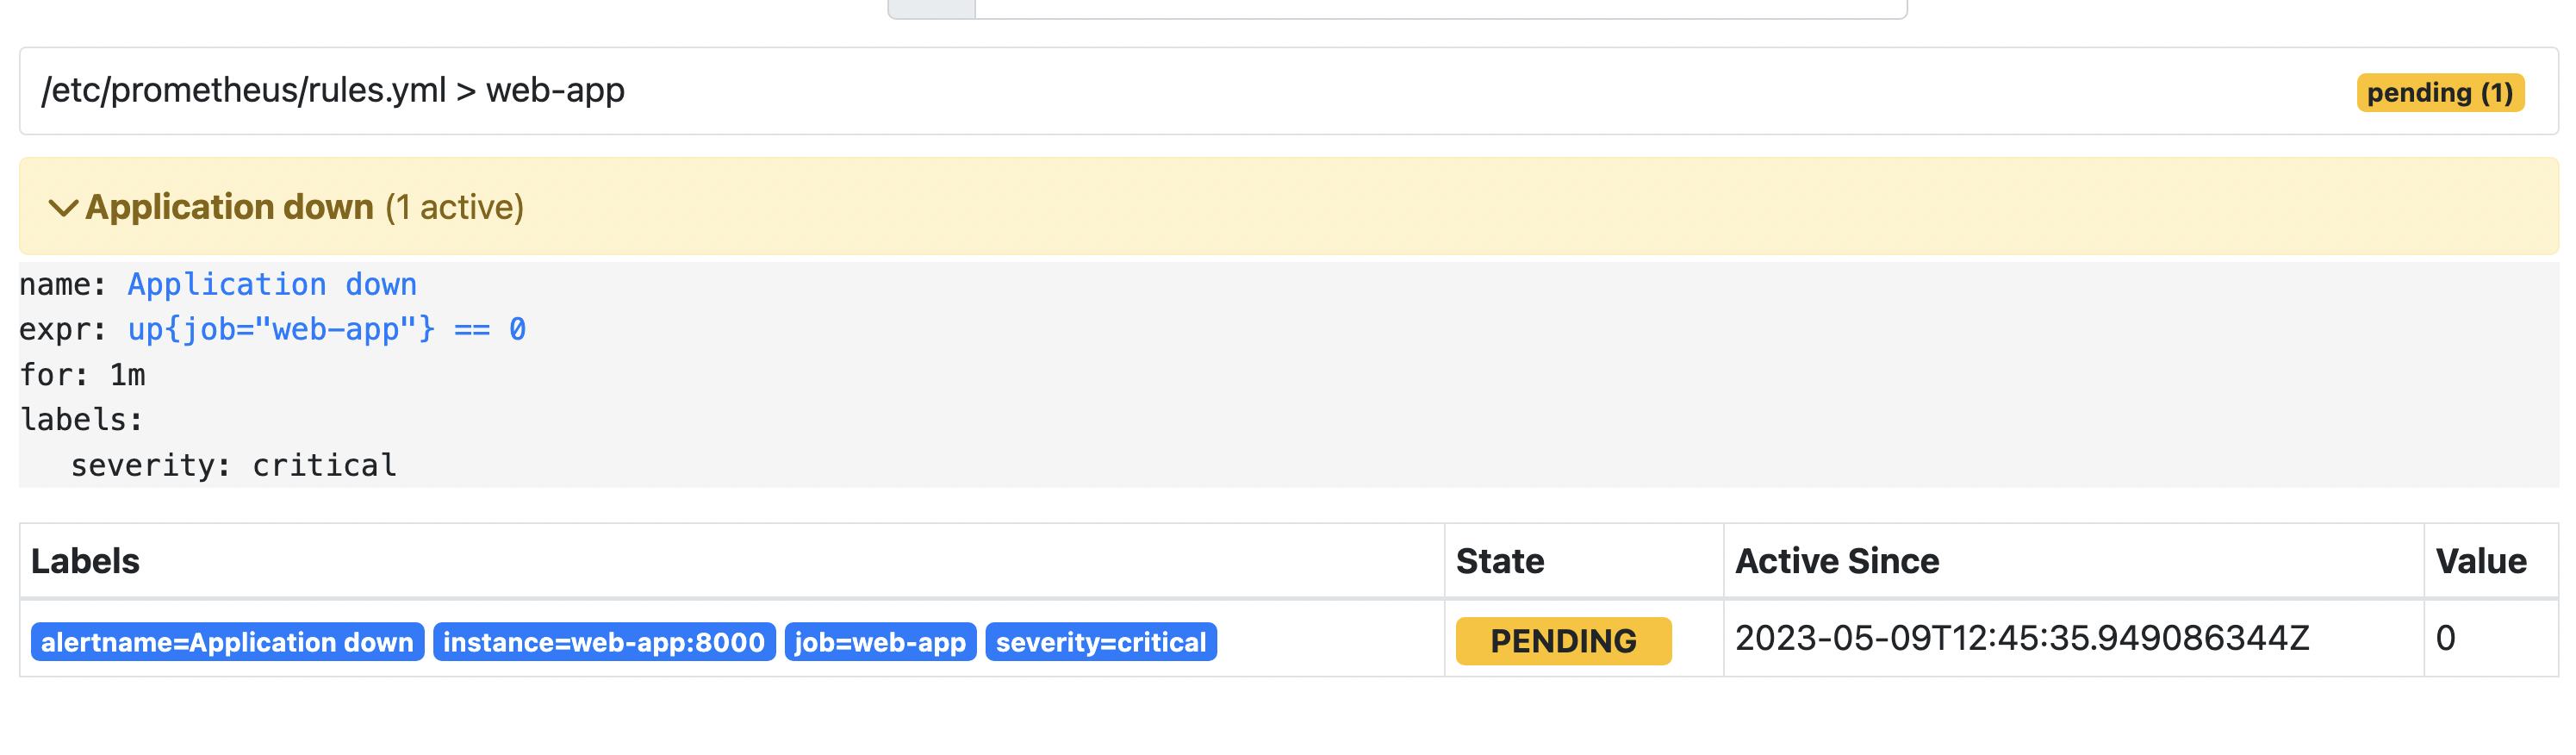
Now our alert is in the pending state. In that state, the expression defining alert is true, but not for 1 minute yet (the time specified in the for parameter).
If we check the situation after 1 minute, our alert would be firing.
As we said before, firing alert would not send a notification, because Prometheus is not responsible for it. In the next step, we configure the Alertmanager to handle firing alerts and send notifications to external systems (e.g. email, slack, etc.).
Alertmanager installation
The easiest way to add Alertmanager to our stack is by modifying Docker compose file. We can use a docker image provided by the Prometheus community (Nevertheless if you would like to install Alertmanager from scratch on a host, here is a great tutorial describing this process step by step).
First, we need to define alertmanager.yml configuration file. At that stage, it would be almost empty. We just want to run the Alertmanager instance. Eventually, we will configure our alert routing and receivers in this file.
# alertmanager.yml
route:
  receiver: default

receivers:
  - name: default
In the next step, we specify the Alertmanager image, and where the alertmanager.yml configuration file would be located. All that stuff would be configured within the Docker Compose file:
# docker-compose.yml
version: "3.7"

services:
  prometheus:
    image: prom/prometheus
    ports:
      - target: 9090
        published: 9090
    volumes:
      - type: bind
        source: ./prometheus.yml
        target: /etc/prometheus/prometheus.yml
      - type: bind
        source: ./rules.yml
        target: /etc/prometheus/rules.yml
      - ./prometheus_data:/prometheus
    command:
      - '--config.file=/etc/prometheus/prometheus.yml'
      - '--storage.tsdb.path=/prometheus'

  alertmanager:
    image: prom/alertmanager:v0.25.0
    ports:
      - 9093:9093
    volumes:
      - type: bind
        source: ./alertmanager.yml
        target: /etc/alertmanager/config.yml
    command:
      - '--config.file=/etc/alertmanager/config.yml'
      - '--storage.path=/alertmanager'

  web-app:
    image: web-app-monitoring:v0
    ports:
      - target: 8000
        published: 8080
We also need to tell the Prometheus Server what is the address of the running Alertmanager instance. There is a special alerting section in prometheus.yml file dedicated to it:
# prometheus.yml

global:
  scrape_interval: 15s
rule_files:
  - "rules.yml"
alerting:
  alertmanagers:
    - static_configs:
        - targets: ["alertmanager:9093"]
scrape_configs:
  - job_name: "prometheus"
    scrape_interval: 5s
    static_configs:
      - targets: ["localhost:9090"]
  - job_name: "web-app"
    scrape_interval: 5s
    static_configs:
      - targets: ["web-app:8000"]
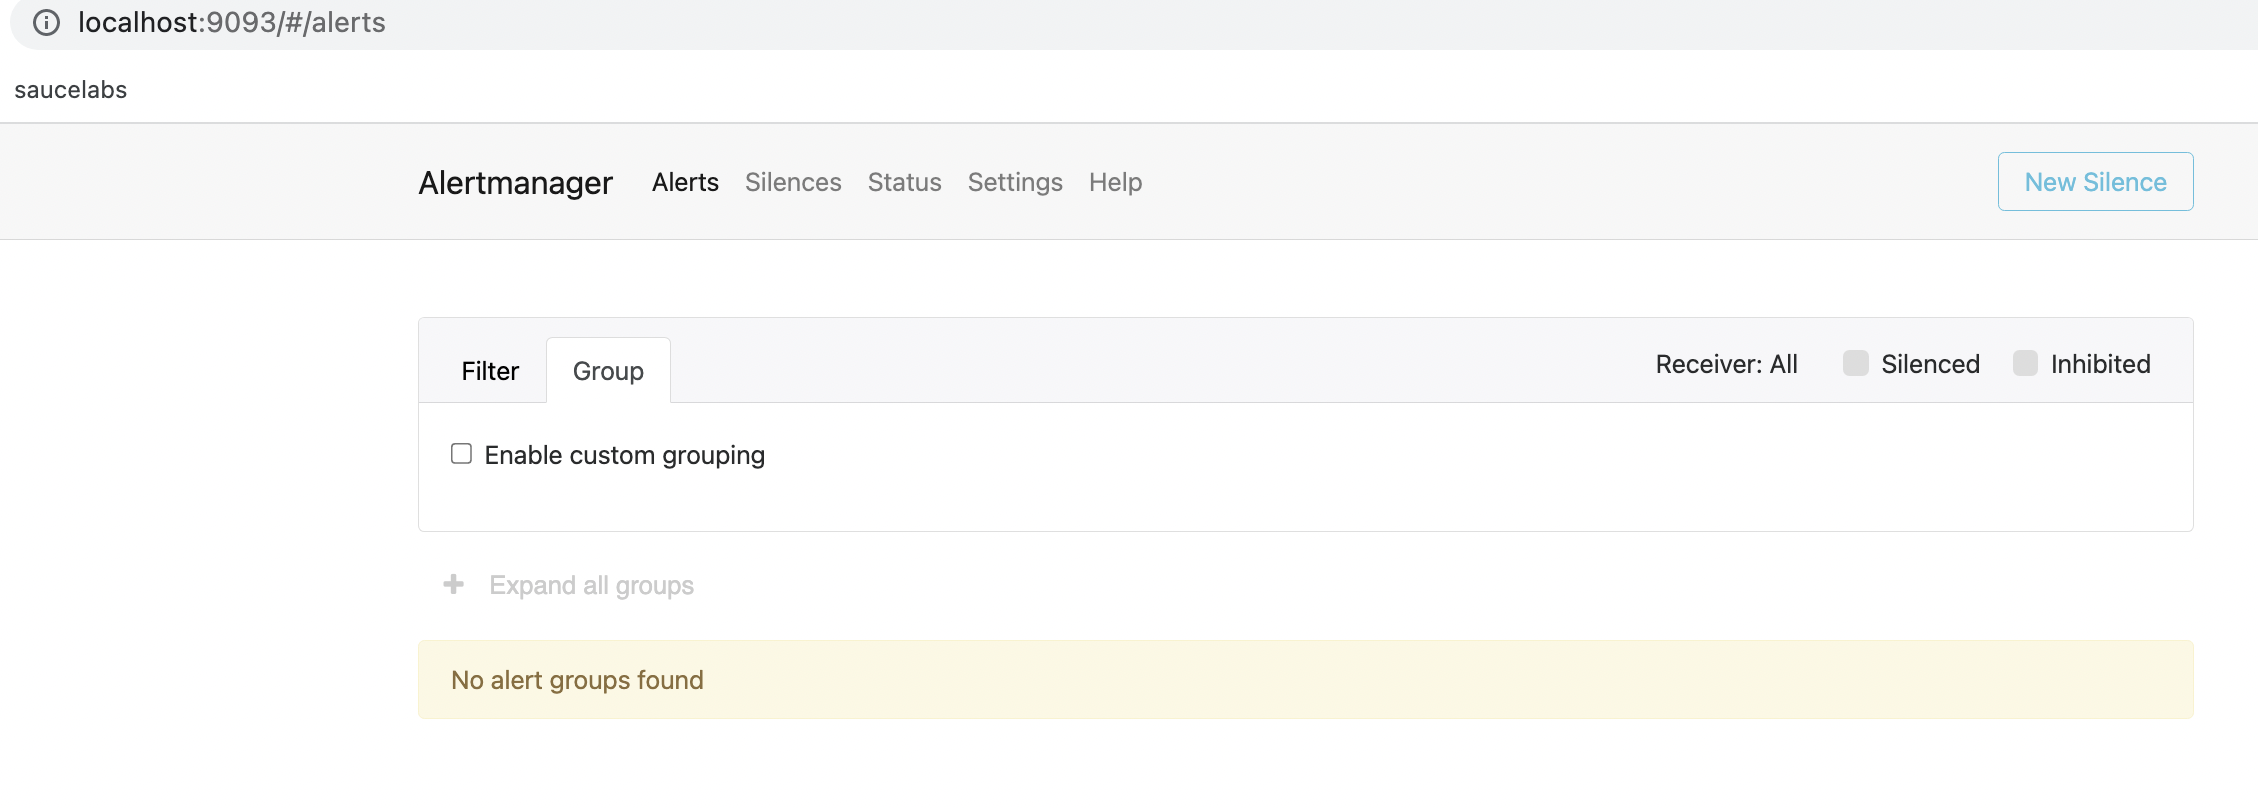
When we restart our Docker Compose file, we would see that the Alertmanager instance is running and is available at http://localhost:9093.
Notifications configuration
In the Alertmanager configuration file, we can specify routing rules for alerts and set up notification receivers. For the purpose of this post, we create a simple Slack integration with our Alertmanger instance.
First, you’ll need to create a Slack bot and obtain an API token. To do this, go to https://api.slack.com/apps and create a new app. Once you’ve created the app, go to the “Bot” section and add a bot user. Then, go to the “Install App” section and install the app in your workspace. Finally, go to the “OAuth & Permissions” section and copy the Bot User OAuth Access Token.
In the next step, add the following configuration to the route and receivers section in the alertmanager.yml file:
# alertmanager.yml

route:
  receiver: default
  routes:
    - matchers:
        - severity="critical"
      receiver: slack
receivers:
  - name: slack
    slack_configs:
      - channel: "#monitoring"
        send_resolved: true
        api_url: "https://hooks.slack.com/services/XXXXX"
        title: Alert
        text: >-
          *Alert:*  - ``
          *Description:*
          *Details:*
             • *:* ``


  - name: default
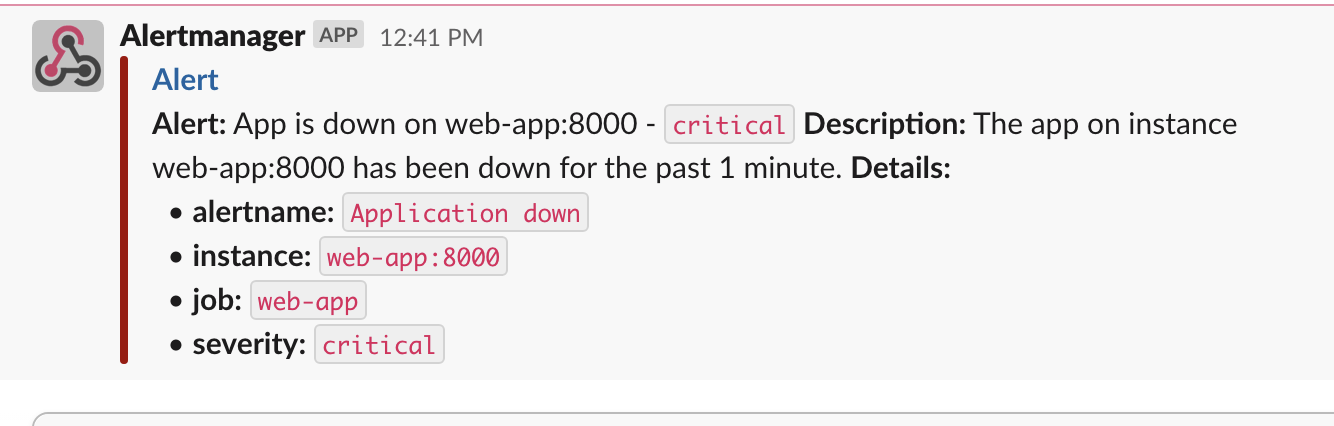
It will route all severity: critical alerts to slack receiver and send a Slack notification to #montioring channel. Under api_url field, you should put your own webhook URL that you obtained in the Slack app installation process.
We can now restart our Docker Compose stack and kill web-app instance again to trigger the “Application Down” alert. It should result in firing the alert and sending the following message on a given Slack channel:
Conclusion
In conclusion, Alertmanager is a powerful tool that allows for efficient alert management and notification handling. It integrates seamlessly with Prometheus and supports a variety of notification channels. By properly configuring Alertmanager and defining appropriate alerting rules, organizations can ensure that they are notified promptly of important issues and can take action to prevent or mitigate downtime. With its ease of use and flexible configuration options, Alertmanager is an essential tool for any organization using Prometheus for monitoring and alerting.
If you are interested in the configuration files presented in this post, you can find them here.